
This java applet is a demonstration of
digital filters. You should hear a noise waveform when the applet starts up.
If you get a message "Need java 2 for sound", then you should get the
Java plug-in.
The applet starts up with a low-pass filter. It shows the frequency response
of the filter, the spectrum of the filtered waveform being played, the waveform
itself, and the impulse response of the filter. Click on the response curve to
change the cutoff frequency.
The freqency response graph shows the filter response (shown vertically, in
dB, with lines at 10 dB intervals) versus the frequency (shown horizontally,
with vertical lines marking off octaves). The spectrum graph shows the spectrum
of the sound output.
The Input popup menu allows you to select an input waveform. The
choices are:
- Noise
- Sine Wave - select the frequency by clicking on the spectrum.
- Sawtooth Wave
- Triangle Wave
- Square Wave
- Periodic Noise - select the frequency by clicking on the spectrum.
- Sweep - a sine wave that sweeps across the frequency spectrum at an
adjustable rate.
- Impulses
- Various mp3 files (you can add your own by downloading the applet and
then editing the index.html file)
The Filter popup menu allows you to select a filter. See
this site for technical details about the
filter types. The choices are:
- FIR
Low-pass - filters out high frequencies (everything below the cutoff
frequency, which is adjustable by clicking on the response graph with the
mouse).
- FIR High-pass - filters out low frequencies.
- FIR Band-pass - filters out everything except a range of frequencies.
Use the Center Frequency and Passband Width sliders to adjust
the range.
- FIR Band-stop - filters out a range of frequencies.
Here are some adjustable parameters that affect the quality of the FIR
filters: the number of points, which you can adjust with the Order
slider (more points is better); and the window, which you select with the
Window popup. An FIR filter is defined by its impulse response, which
you can view near the bottom of the window. To view the window function,
select FIR Low-pass, set the cutoff frequency near zero and look at
the impulse response.
- Custom FIR - draw on the frequency response graph to specify your own
filter. The actual response, shown in red, is affected by the Order
slider and Window popup.
- None - no filtering
- Butterworth
Low-pass - a flat filter that filters out high frequencies
- Butterworth High-pass - a flat filter that filters out low frequencies
- Butterworth Band-pass - a flat filter that filters out frequencies
outside of a certain band
- Butterworth Band-stop - a flat filter that filters out frequencies
inside of a certain band
- Chebyshev
Low-pass - a low-pass filter with an adjustable amount of ripple in the
passband
- Chebyshev High-pass, Band-pass, Band-stop
- Inv Cheby Low-pass - inverse Chebyshev (also known as Chebyshev type
II), a low-pass filter with a flat passband, but an adjustable amount of
ripple in the stopband
- Inv Cheby High-pass, Band-pass, Band-stop
- Elliptic
Low-pass - (also known as Cauer) a low-pass filter with an adjustable amount
of ripple in the passband and stopband. Adjusting the Transition Band
Width will change the stopband attenuation.
- Elliptic High-pass, Band-pass, Band-stop
- Comb (+) - this
filter (used on noise) sounds like someone blowing into a tube.
- Comb (-) - this is a tube with one end covered.
- Delay - an echo filter (the same as a comb filter, but with longer
delays)
- Plucked-String Filter - when the Input popup is set to
"Impulses", this sounds like a string being plucked.
- Inverse Comb
- Reson - resonates at one frequency
- Reson w/ Zeros - a reson filter with zeros added at 0 and half the
sampling rate
- Notch - filters out a narrow range of frequencies
- Moving Average - a simple FIR attempt at a low-pass filter. This filter
(when used on noise) reminds me of an Atari 2600.
- Triangle
- Allpass - passes all frequencies equally, but with different phase delay.
Use the Phase Response item in the View menu to view the phase
response. For low frequencies, this filter acts as a fractional delay (a
delay of less than one sample).
- Gaussian - the impulse response and frequency response are both gaussian-shaped
- Random
- Custom IIR - drag the poles and zeros around to change the filter.
The Sampling Rate popup allows you to view or change the sampling rate.
You can't change the rate if the input is an MP3.
The View menu allows you to turn on or off the various views. The
Log Frequency Scale item which shows the frequency response using a
logarithmic plot instead of linear. The Show Entire Waveform item will
compress the waveform segments horizontally so that each one fits in the window;
this way, all of the waveform will be displayed, but the window usually won't be
wide enough to show each sample separately. The Ferris Plot item will
display a Ferris
Plot of the transfer function.
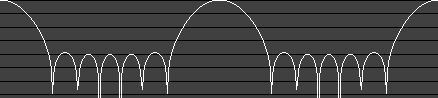
When displaying the frequency response, the applet only shows the portion of
the spectrum from 0 to the
Nyquist frequency
(đ). The rest of the response up to 2đ is just a mirror image of this, and then
the response repeats every 2đ. For example, here is a frequency response as
displayed in the applet (up to đ):
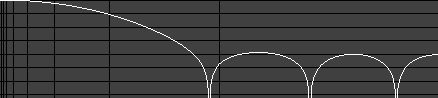
Here is the response up to 4đ:
Good books about digital filters: