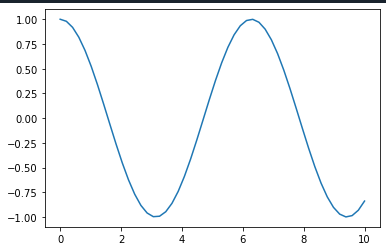
Graghing y=cos(x) with Python
To create a simple plot of the cosine we use the cos( ) method, and for the x-axis values the linspace( ).
At first, we will import the relevant libraries (Matplotlib and NumPy) and create the data we will use for the graphic display (plot data).
x=np.linspace(0,10)
[ 0.          0.20408163  0.40816327  0.6122449   0.81632653  1.02040816
  1.2244898   1.42857143  1.63265306  1.83673469  2.04081633  2.24489796
  2.44897959  2.65306122  2.85714286  3.06122449  3.26530612  3.46938776
  3.67346939  3.87755102  4.08163265  4.28571429  4.48979592  4.69387755
  4.89795918  5.10204082  5.30612245  5.51020408  5.71428571  5.91836735
  6.12244898  6.32653061  6.53061224  6.73469388  6.93877551  7.14285714
  7.34693878  7.55102041  7.75510204  7.95918367  8.16326531  8.36734694
  8.57142857  8.7755102   8.97959184  9.18367347  9.3877551   9.59183673
  9.79591837 10.        ]